
Steam Inventory Value: How to Estimate What You Could Actually Receive
Why inventory value sites disagree, and how to estimate what you would receive: pick a price, divide by 1.15, drop unsellable items, check depth, write a range.
Article languages
On this page
Put the same Steam inventory into two valuation sites and you can get two totals that are far apart. Which one is wrong? In my reading, usually neither, because each total answers a different question. One site adds up the lowest Market listings and stops there. Another subtracts fees first. A third prices your items on a cash market, not on the Steam Community Market.
This article skips the site totals and builds the estimate by hand, in the order you would calculate it: pick a price, step down from what a buyer pays to what a seller receives, remove the items you cannot sell, check whether your quantity moves the price, and write the result down. The result is a range, "from this much to that much", and the last section says why.
Three neighbouring topics are left to other pages. Checking whether an item can be traded is the job of the inventory checker, and here I look only at price. Why a Steam Wallet balance loses value when you try to turn it into cash has its own post. The mechanics of the fee are explained in how Steam Market fees work; I borrow its 5% plus 10% model and use it only to reach a total.
My sources are pages I opened on October 27, 2026. From Steam Support I read the Community Market FAQ, the Trading and Market Restrictions page, the holds page, the Steam Trading FAQ and the page on trade and market confirmations, and I read the Steam Subscriber Agreement. Two outside pages calculate inventory value: a CS2 tool at a steamdb.com address and a how-to post on CSDelta. I read one Steam Market item page twice, at about 3:40 pm and 3:43 pm Korean time, and saved the text. I opened the Community Market FAQ in English and in Korean, and the fee and limit numbers were the same in both. The other Support pages I read in English only.
I read everything signed out, so I have never seen the sell window. Both outside pages centre on CS2, and I do not know whether other games work the same way. I never ran either site's tool on a real inventory. Every holding in the text is an assumption made for illustration. Some prices are values I read that day and some are invented, and I say which each time.
Six places where two totals for one inventory come apart
The CS2 inventory value tool at the steamdb.com address shows three totals for one inventory. The first is the sum of the lowest current Steam Market listings. The second is the best net payout if each item were listed at the floor of a real-money marketplace, with that venue's seller fee already deducted. The third is the instant-sell floor, what the best buy orders would pay, net of fees. The page calls the first number the "paper" number, because Steam keeps roughly 13% on a sale and the proceeds stay in the Steam Wallet. The footer of that page names an independent project called Steam Dashboard that is not affiliated with Valve, so I refer to the tool only by its address.
The CSDelta post takes another route. It says its total is a listing-price estimate for the selected marketplace mode and that it does not subtract Steam's seller fee automatically. Prices for stickers and charms that are applied to an item show on the item as tooltips and are not added to the total. Float values and pattern premiums above the base ask are not added either; the exception it names is Doppler phases, which are priced separately when the catalog has an entry for the phase. The same inventory can be switched between Steam, individual markets, Lowest and Average, so even within one site there are several totals.
The two pages also describe the same fee in different ways. The tool says Steam keeps roughly 13% of a sale. The post says CS2 sales on Steam take about 15% in seller fees. Both mean a 5% Steam fee plus a 10% CS2 game fee. My reading, and it is a reading and not something either page spells out, is that 15% is a share of what the seller receives, while the same fees come to about 13% of what the buyer pays. The tool's method page supports this, because it says the seller gets the buyer's price divided by 1.15. Neither number is wrong, but mixing them in one formula gives a wrong result.
Together with the Steam pages, the two sites give six places where totals diverge.
| Where totals differ | What the pages I read say |
|---|---|
| Price type (lowest listing, buy order, sale median or another market's price) | The steamdb.com method page says its prices are live asks and buy orders, not completed sales. |
| Fees | The steamdb.com tool shows totals net of fees and not net of fees side by side. CSDelta does not subtract Steam's fee automatically. |
| Market and currency | steamdb.com matches against a snapshot covering 36 marketplaces and CSDelta against 30 or more sell-side sources. steamdb.com says converted currency prices are display estimates. |
| Item detail | Both match prices by item name. Float, sticker and pattern premiums are not in the total (CSDelta makes an exception for Doppler phases). |
| Unpriced items | steamdb.com lists items with no quote separately and sums only the items it can price. CSDelta leaves an item blank when the chosen market has no quote. |
| Time | steamdb.com stamps the date of its price snapshot and says prices refresh daily, so a snapshot can be a day old. The stamp moves daily: it read October 26, 2026 at the first reading (06:35 UTC on October 27) and October 27 when I opened the page again at about 10:55 UTC. |
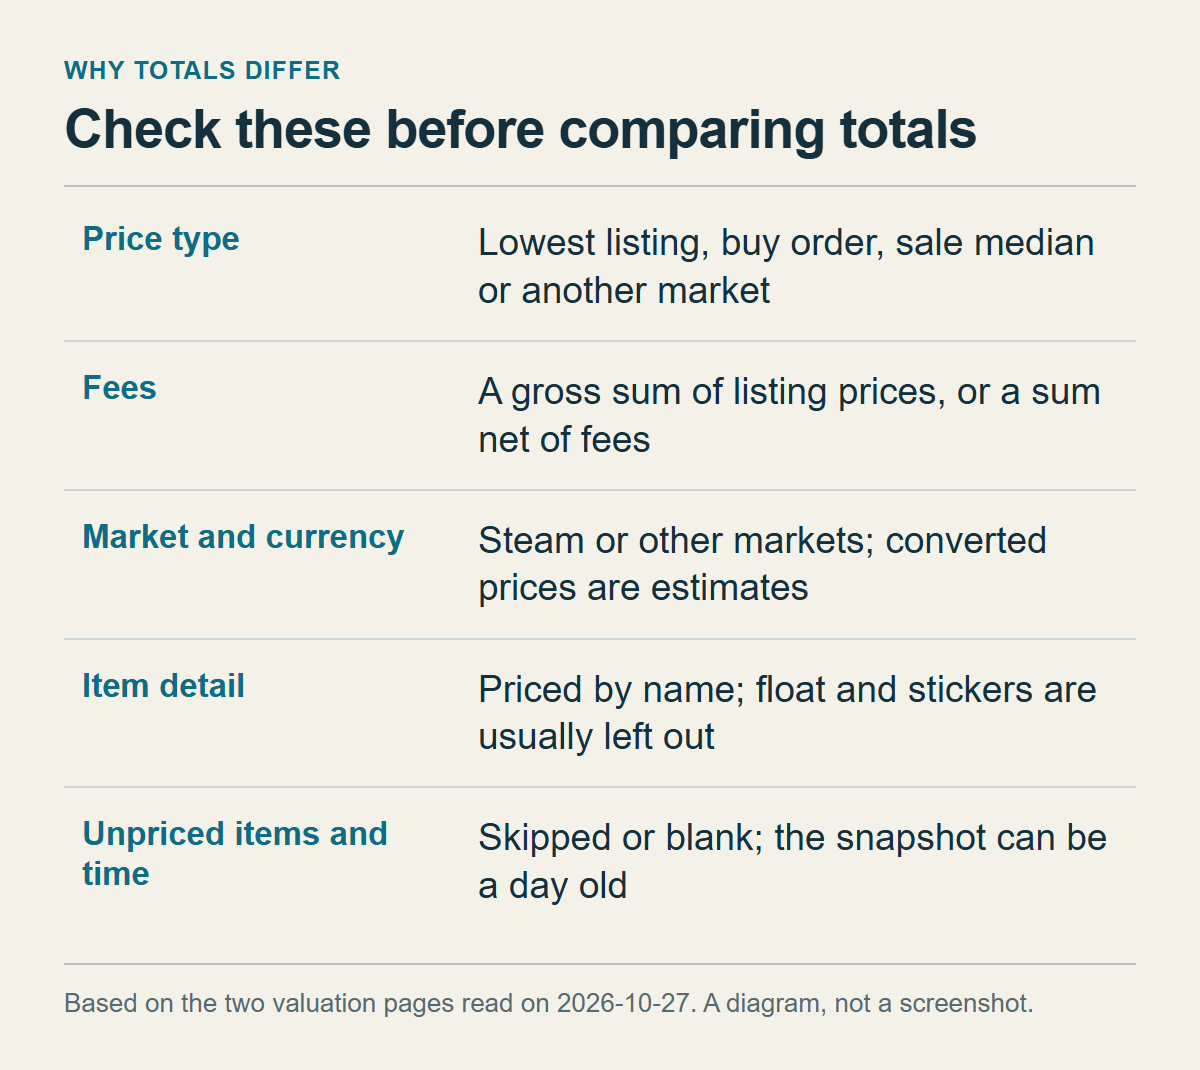
The picture above shows these six switches as five rows: unpriced items and snapshot time share one row, so the table here keeps them apart. When two totals disagree, look for which of the six differs. Averaging them mixes answers to different questions. If a site does not state its settings, I would read its total as a pre-fee sum of listing or ask prices. The only basis for that is that both pages I read behaved this way, so it is my judgment and I do not generalize from it.
Neither page says whether items that are not tradable or not marketable are left out of the total. I sort that out myself in the section on unsellable items.
Lowest listing, buy order or sale median: which price to multiply
A Steam Market item page has at least three prices. In the English interface the first reads "for sale starting at", the second reads "requests to buy at ... or lower", and a chart titled Median Sale Prices has Week, Month, Year and Lifetime views. In the Korean interface the same three parts are labelled with words that translate as lowest price, buy order and average sale price. A median and an average are different statistics, and nothing I opened settles which one the chart computes. I go by the English label. A public price lookup response has separate fields named lowest_price, median_price and volume. None of the Steam Support pages I read defines those fields.
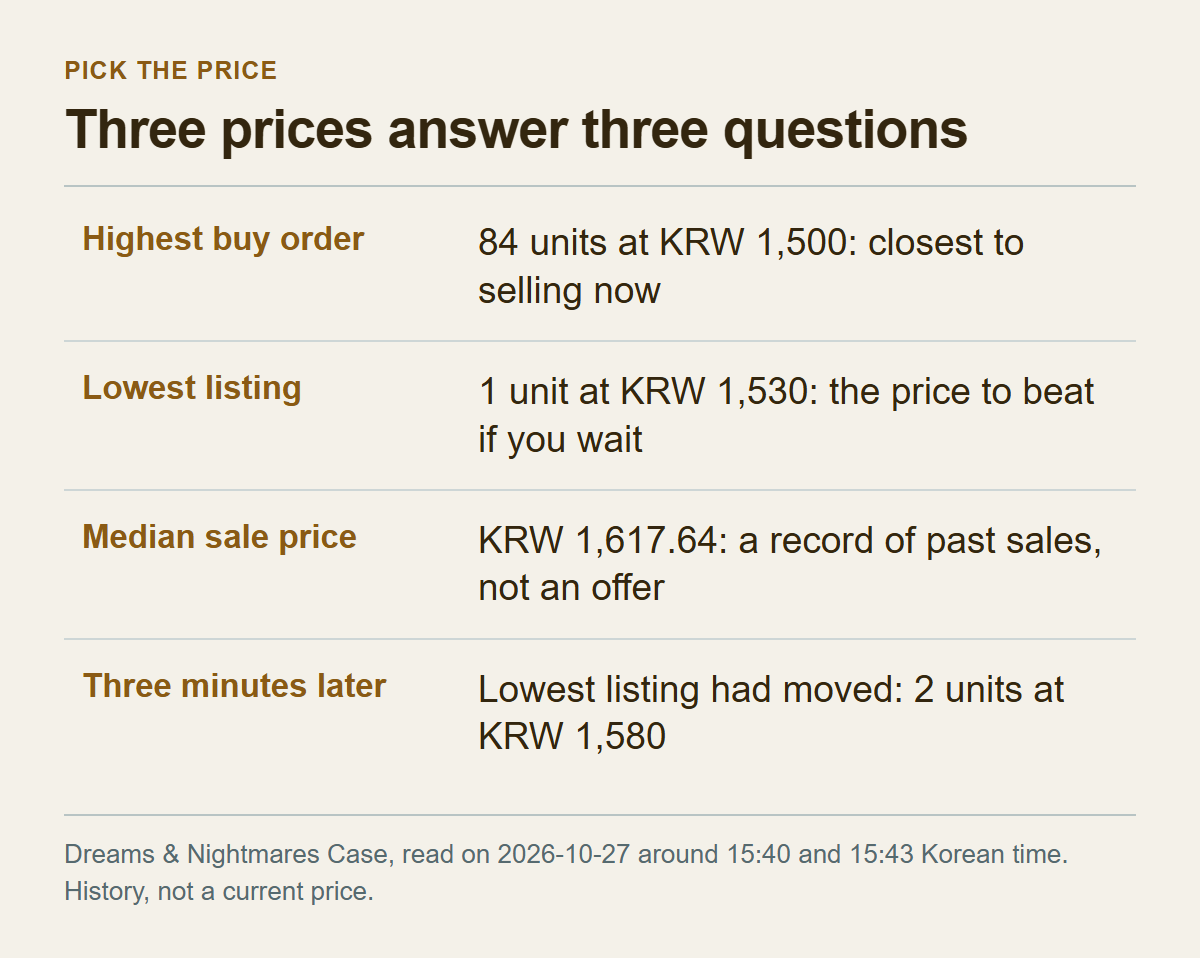
The three prices answer different questions. The lowest listing is the cheapest a buyer can pay at once, and for a seller it is the price to beat when waiting. The highest buy order is close to what a seller gets by selling immediately. The Community Market FAQ says buy orders help sellers for this reason: you can see what others will pay, so you can choose a lower price to sell immediately or a higher one and wait. The chart is titled Median Sale Prices, which suggests it summarizes past sales, but no page I opened defines the median or its period. I read it as a reference to past trades and not as a price anyone is offering.
To see how far apart they get, I looked at one item, Dreams & Nightmares Case in CS2, on the page and in the public response. Prices are in won.
| What I read | About 3:40 pm Korean time, October 27, 2026 | About 3:43 pm |
|---|---|---|
| lowest_price in the price response | 1,590 | not read |
| median_price in the price response | 1,617.64 | not read |
| Lowest listing on the item page (units at that price) | 1,530 (1 unit) | 1,580 (2 units) |
| Highest buy order (units at that price) | 1,500 (84 units) | 1,500 (82 units) |
The readings show four things. The median of 1,617.64 won sits about 7.8% above the highest buy order of 1,500 won. The median carries a fraction of a won, while every listing and buy-order row I read was a whole number of won, so it looks like a computed value and not an offer. The lowest price also differed between two readings a few seconds apart: 1,590 won in the response and 1,530 won on the page. I cannot tell why from what I have. The 1,530 row held a single unit, so it may have been listed and sold in between, or the two answers may come from different moments. Three minutes later the lowest listing was 1,580 won with 2 units behind it. A top row that holds one or two units moves easily.
So instead of one number I take a pair. The low end is the highest buy order and the high end is the lowest listing, both before fees and both on the buyer's side. For this item that is 1,500 and 1,530 won, a spread of 2%. The median was outside both ends, so I keep it as a reference and leave it out of the range. A median far from the standing offers may mean the price moved recently or that the item trades rarely, which is my inference, and in that case I widen the range. What period that median covers is not stated on any page I opened, so I cannot say whether the price is rising or falling.
The pair only suits commodity items, where every unit is identical. The item page says for these items that individual listings are not accessible and that the cheapest listing is matched with the highest buy order. Skins are different. Two skins with the same name can differ in float and stickers, and the two outside pages leave those premiums out of their price math, so a price by name cannot tell you whether your copy is above or below it. For a few expensive skins I would open two or three comparable listings myself and use the low and high of those as the pair.
Divide the buyer's price by 1.15 instead of multiplying by 0.85
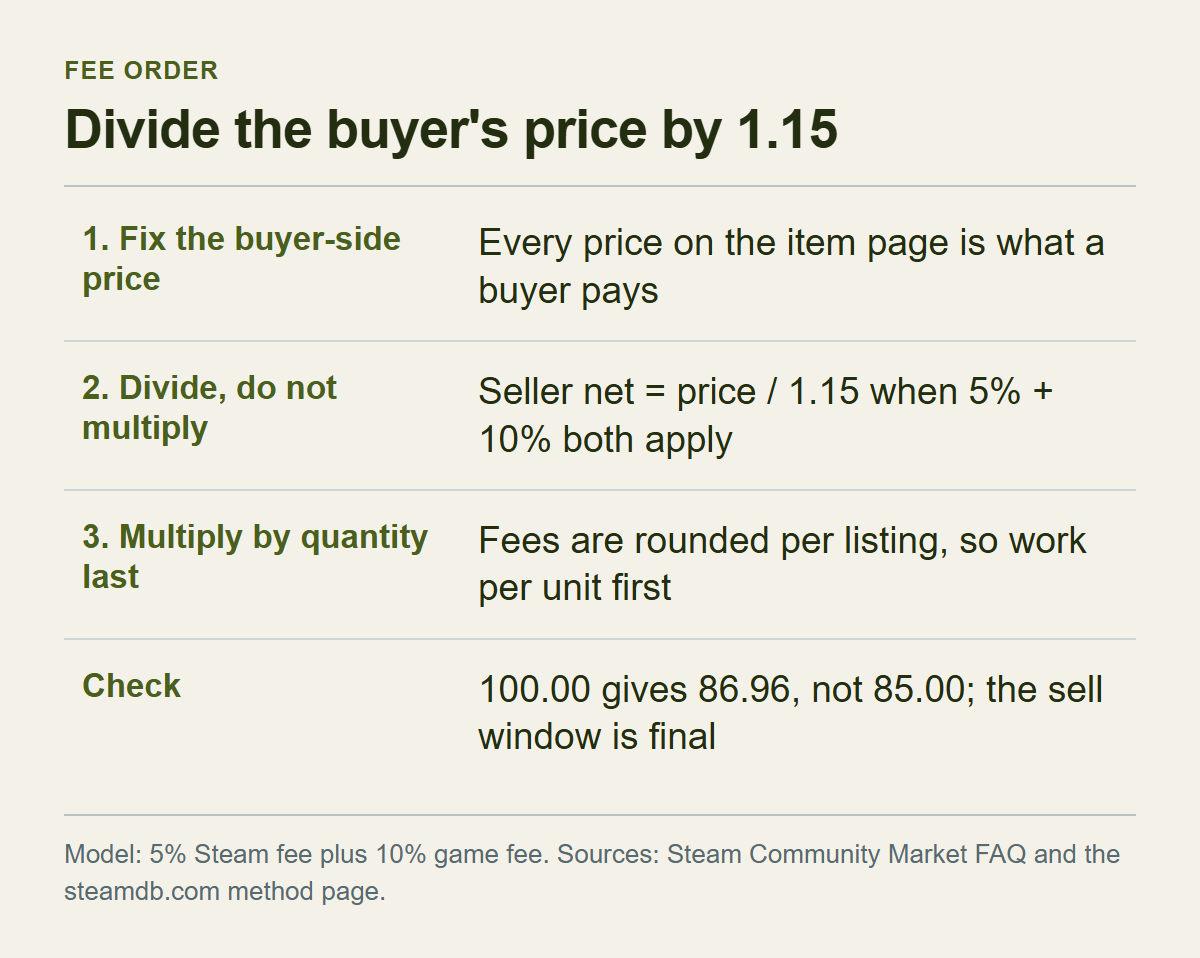
I treat every price on the item page as the buyer's side, the amount a buyer pays. The FAQ says the buyer pays the fee and the page text does not say anywhere that the fee is already inside the displayed price, so this is an assumption, but it is the one I work with. A seller receives that amount minus fees, and that is what this article tries to estimate. The order is: fix the price, step down to net per item, and multiply by quantity last. The multiplication goes last because rounding may happen per listing. The SteamVaults calculator floors percentage fees to the smallest currency unit and applies the minimum fee to each listing. I could not confirm that Steam does the same, but working out the amount per item first and multiplying afterwards is safe either way.
The FAQ states two fees. As I read it on October 27, 2026, the Steam Transaction Fee is 5% with a minimum of $0.01, paid by the buyer, calculated from the item cost, and shown on the confirmation page before purchase. The game-specific fee is set and collected by the game publisher, and the FAQ lists it at 10% for Team Fortress 2, Dota 2, Counter-Strike 2 and Artifact. This article uses the same model as the fee post: both fees apply, and the buyer's price is the seller's net plus 5% and 10%. The FAQ does not say what "item cost" is a percentage of, so that is a model and not a Valve statement. The steamdb.com method page reads it the same way. It says a Steam seller receives the buyer's price divided by 1.15 and that this takes about 13% off the gross.
The fee post works through multiplying versus dividing on one listing, so I only recap. Fifteen percent is a share of what the seller receives. Multiplying a buyer's price by 0.85 therefore understates the net, and dividing by 1.15 is the right direction. For 100 dollars the net is about 86.96, not 85. The SteamVaults calculator, using the same model, shows 86.97.
In a total the difference looks like this. Take the median from the previous section and a holding of 100 units, which is an illustrative quantity. The median total is 161,764 won. Multiplying by 0.85 gives about 137,499 won, and dividing by 1.15 gives about 140,664 won, a difference of more than 3,000 won. The prices are values I read and the quantity is invented. The figure divided by 1.15 is the result of the 5% plus 10% model, not a number Steam supplied.
The minimum fee needs one caution. The only evidence of a minimum I found is USD 0.01, and I did not find the minimum unit in won. So the won arithmetic above is plain division with no rounding. A 1-cent minimum on the game fee is an assumption of the SteamVaults calculator and is not confirmed by the FAQ. When you hold dozens of cheap items, small errors add up with the count, so make the range wider.
One post on this site pulls the other way. The post on why the lowest price is not your minimum selling price warns against treating a public price as the amount the sell form will accept, or as the final amount left in the Wallet after a sale. This estimate claims neither. It divides public prices by 1.15 only to approximate many items as a range, and then asks you to check one unit in the sell window, where the figure on screen overrides every number here. The public price is the only raw material available for a rough estimate. The same post lists Dreams & Nightmares Case at a lowest display of 2,290 won on August 24, 2026, while I read 1,530 to 1,580 won for the same item on October 27. Both are dated history, so neither one tells you a trend.
Tax is not in the model. The Subscriber Agreement says Valve collects sales tax, VAT or GST for Subscription Marketplace transactions where the law requires it, and the item pages I read carry a footer saying VAT is included in all prices where applicable. Which part of a buyer's price is tax in your country is not on the pages I opened. If tax is inside the buyer's price, the real net may be lower than the figure divided by 1.15.
Which items to take out of the total first
The outside totals add prices matched by item name. The two pages I read do not say how they treat the tradable or marketable flags in your inventory. The Steam rule is clearer. According to the Market FAQ, only items that are eligible to be sold appear when you pick something to sell, and Steam Support cannot change an item to make it sellable. An item missing from that list adds zero to what you receive, even if a site has put a price on it.
You read the flags in the item description. The Steam Trading FAQ says to select an item in your inventory and check the Tags section of its details to see whether it is tradable. For some items the Market FAQ says to read the item description in your inventory to see when it can be marketable. Tradable and marketable look like separate properties: marketable decides whether you can list the item, and so what lands in your Wallet, and tradable decides whether it can move to another account. This calculation assumes a Market sale, so I key it on marketable. An item that can be traded but not listed would count as zero in this estimate, while a site that uses other markets' prices may still value it. That, as a reason for differing totals, is my inference.
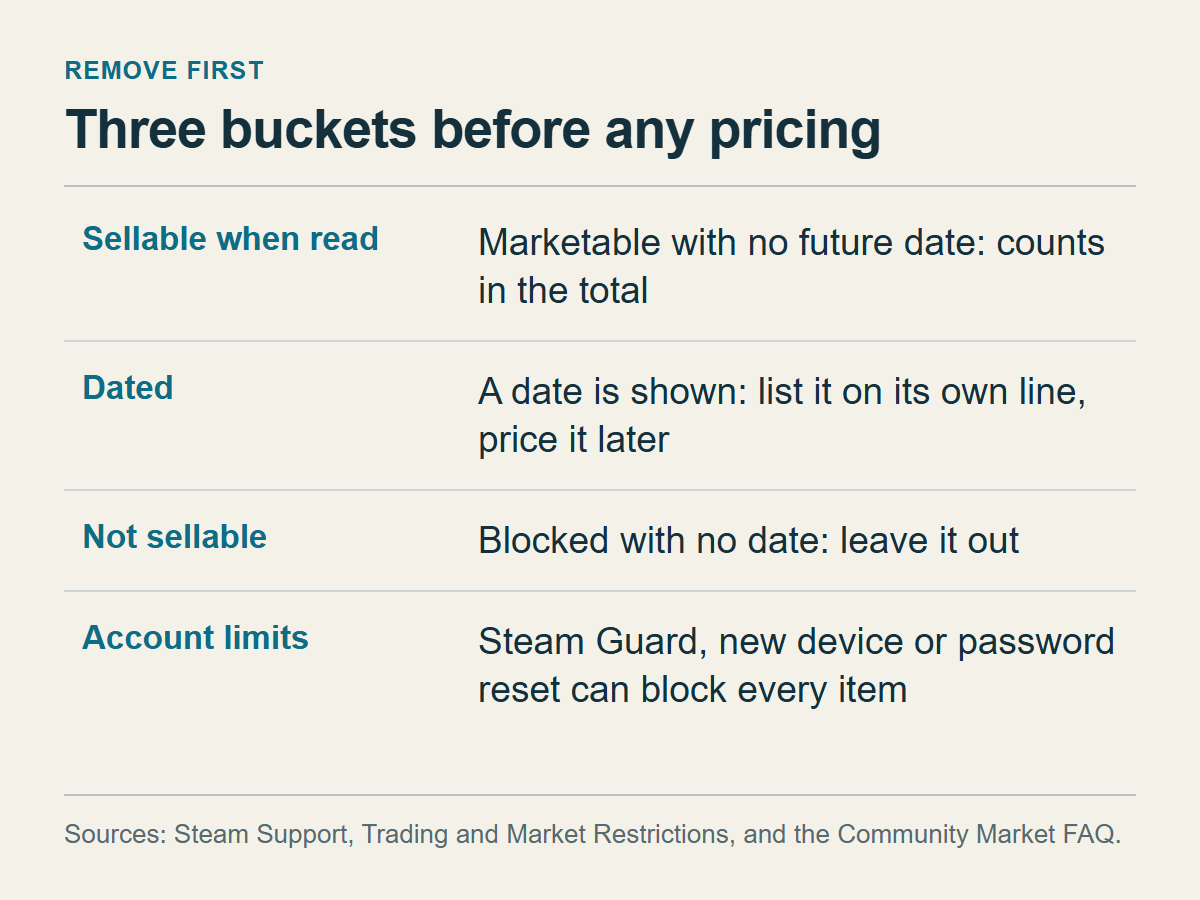
Some restrictions come with a date. The Trading and Market Restrictions page says items purchased in-game or on the Community Market are not tradable or marketable until the date shown on the item in your inventory. The Market FAQ adds that timed drops from Dota 2 are permanently not marketable, and that some third-party game items might not be marketable after purchase. So I sort an inventory into three buckets.
| Bucket | What the item description shows | How it enters the total |
|---|---|---|
| Sellable when read | Marketable, and no future date | Counts in the sum on the sheet. |
| Dated | A date when Market sale becomes possible | Leave it out of the total and write it as its own line for after that date. Its price on that date is unknown. |
| Not sellable | Shown as blocked, with no date | Leave it out. Do not treat it as something to wait for. |
The third bucket rests on one thing: I found no source saying that waiting lifts a block that shows no date. The post on why an item is not tradable or marketable goes through cases where an item turns out not to be tradable or marketable.
An account-level block makes every item count as zero, however healthy the items are. The reasons, including Steam Guard periods, a new device, a password reset and removing an authenticator, and their lengths are laid out in that same post, and the Restrictions page states that Steam Support cannot change them. Before sorting items one by one, check that Market selling is open on your account at all.
Holds are a timing matter. The holds page describes a trade hold as a period of up to 15 days after a trade is accepted, and a market hold as a period after a listing is created before the item is available on the Market, and says holds apply when the account has not had a Steam Guard Mobile Authenticator for at least the last 7 days. It is silent on price and amount, so I make no claim about either. The trade hold versus market hold post carries the definitions and lengths.
If you want to scan these flags in one pass, the SteamVaults inventory checker gathers the tradable and marketable markers and release dates. Its page says it shows public inventory status and does not judge tradability across the account or price, so price comes from this method. It cannot read a private inventory, and the steamdb.com tool and CSDelta say the same about theirs.
Look at the order book before you multiply by quantity
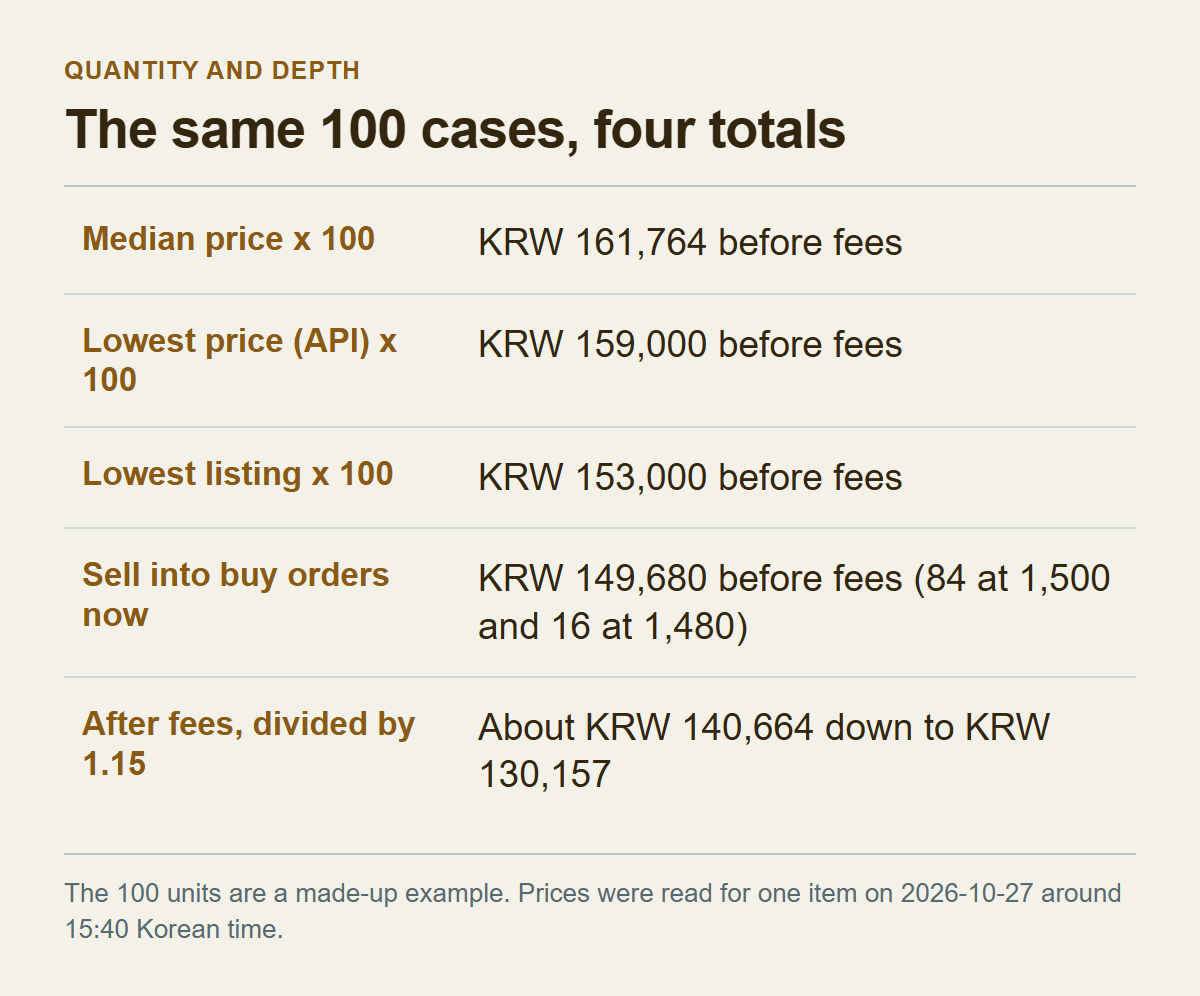
Valuation sites multiply a price by a quantity. A holder of 100 units gets lowest price times 100. But the lowest-price row I read held only one or two units. Opening the top of the book shows what the multiplication assumes. These are the top rows for Dreams & Nightmares Case at about 3:40 pm, in won.
| Sell listing price | Quantity | Buy order price | Quantity |
|---|---|---|---|
| 1,530 | 1 | 1,500 | 84 |
| 1,590 | 2 | 1,480 | 66 |
| 1,600 | 3 | 1,470 | 1,377 |
| 1,610 | 85 | 1,460 | 734 |
| 1,620 | 857 | 1,450 | 97 |
| 1,630 or more | 552,717 | 1,440 or less | 2,638,519 |
Suppose you hold 100 of this case. The quantity is invented, and the prices are the ones from the table and the previous sections. The same 100 units come out differently depending on the method.
| Method | Total at buyer's prices | Net after dividing by 1.15 |
|---|---|---|
| median_price times 100 | 161,764 | about 140,664 |
| lowest_price in the price response times 100 | 159,000 | about 138,261 |
| Lowest listing on the page, 1,530, times 100 | 153,000 | about 133,043 |
| Selling straight into buy orders (84 at 1,500 and 16 at 1,480) | 149,680 | about 130,157 |
The largest and smallest totals are 12,084 won apart, which is 7.5% of the median total. That is smaller than the 13% fee but not negligible. The choice of price field accounts for about 72.5% of that 12,084-won gap (8,764 won, the median total against the lowest-listing total of 153,000). Depth accounts for the other 3,320 won, about 27.5% of the gap, which is the difference between the lowest-listing total and the sell-straight-away total and about 2.2% of 153,000. The five visible buy rows hold 2,358 units, so 100 units are absorbed in the top two rows. Even at 1,000 units the calculation stays inside the visible rows: 84 at 1,500, 66 at 1,480 and 850 at 1,470 add up to 1,473,180 won, which is 3.7% below 1,000 times the 1,530 lowest listing (1,530,000).
This is one item, so I cannot generalize. For an item with a thin book, the same calculation could show a much larger depth effect. For a deep market like this case, choosing the price field matters more. Which of the two applies to your item you can see at once from the quantities in the top five rows of its page.
Selling into buy orders is the fastest way to meet a buyer, while listing at the lowest price means waiting in line. The FAQ says that a buy order picks the cheapest listings first and then the oldest listing, the seller who has waited longest. Following that rule, if you list 100 units at 1,530 won, earlier listings at that price stand ahead of yours. The FAQ does not say whether Buy now follows the same order, so I could not confirm it. I do not know how many units sell per day either. The price response had a volume field with the value 87,152, but no Steam page I read gives its period or definition, so I did not read it as a daily volume. The post on the minimum selling price takes the same position on that field.
Items that are not commodities have no order book of this kind. The FAQ says commodity items have no individual listings, which implies, as my inference, that other items do, each listed separately, and the lowest price is that of the single cheapest copy. Price times quantity holds only when the copies are identical. Several skins with the same name but different floats need their own price on each line.
The result is Steam Wallet funds, not cash
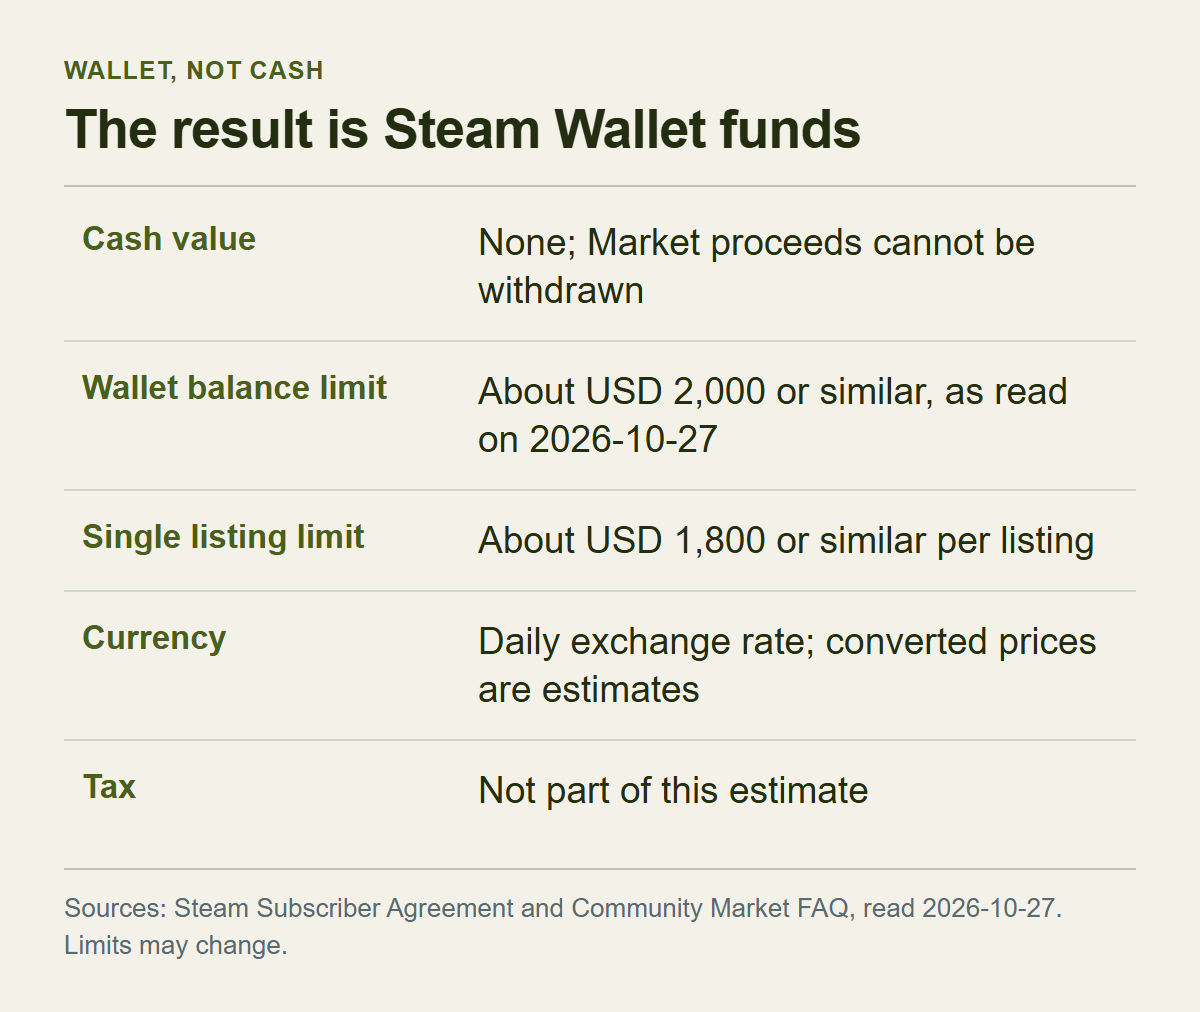
The net you calculated is not cash. The Steam Subscriber Agreement says the Steam Wallet is neither a bank account nor a payment instrument but a prepaid balance, and that Wallet funds have no cash value and are not exchangeable for cash. The Market FAQ says Market proceeds cannot be withdrawn or transferred to another Steam account or to a bank or third-party account, though the funds can buy Steam gifts. The final number of this article means "this much usable inside Steam". For someone who plans to buy games on Steam, that is useful as it is. For someone who does not, its uses are narrow.
Cash figures are a separate calculation. The steamdb.com tool shows three totals. Its second total uses a real-money marketplace and that venue's seller fee, which is a different market from the Steam Market calculation here, and its third is built from buy orders and names no market. If a site's total is much higher than the net you worked out, one thing to check is whether it prices another market. Why Market numbers and cash numbers drift apart is covered by the cash price post, which sorts them into four numbers. In that frame, this article's result is one box: the buyer's total minus fees, which is the seller's Wallet net.
There are limits too. The FAQ limits Wallet balances (about 2,000 dollars as I read it on October 27, 2026) and the price of a single listing (about 1,800 dollars), and it blocks a listing if the balance plus the sale price would exceed the limit. I read this as applying when you create a listing, so I do not claim that a total above the limit makes selling impossible. The FAQ says Steam may change the limits and that other currencies get a similar value. It gives no won figure, so I put none in this article. How to read the limit, and the separate 24-hour sentence in the Subscriber Agreement, are covered by the Wallet balance limit post.
Currency also splits totals. The FAQ says sellers list in the currency of their own Wallet and buyers see prices in the currency of theirs, with an exchange rate updated daily applied to listings in another currency. A won price on a Steam screen may have passed through that rate. An outside site may convert dollar prices to won with its own rate, which is why the steamdb.com method page calls converted prices display estimates. Either can make won totals differ between sites. It is also why a total from someone's dollar screen should not be set against your won figure.
Income tax is not in this calculation. The FAQ says countries have different rules on taxing digital transactions and that the responsibility for any income tax liability lies with you.
Write the estimate as a range with a time stamp
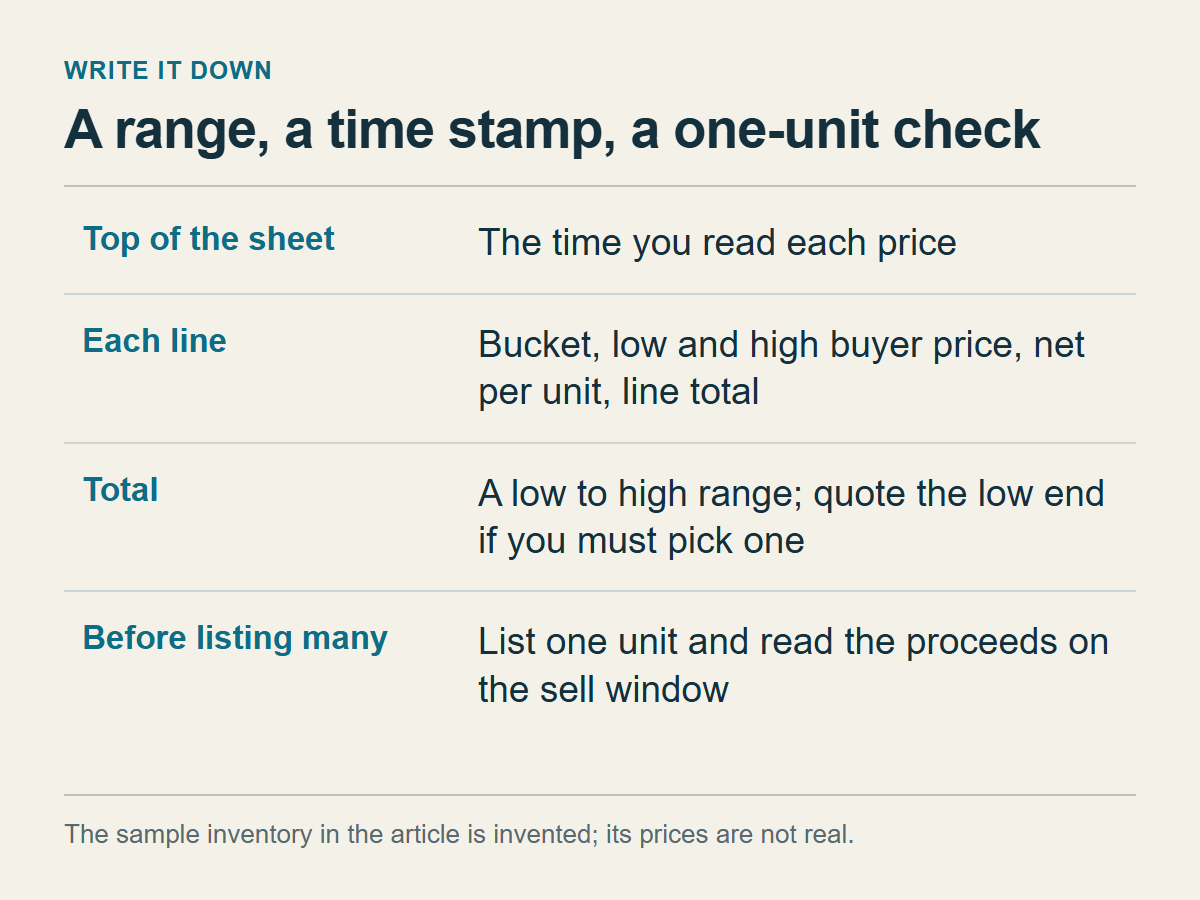
Put the steps on one sheet. Write the time you read each price at the top. For each line write the item, quantity, bucket, the low and high buyer-side price, net per unit (divided by 1.15) and the line total. The table below is an invented inventory. The quantities and prices are made up and are not real quotes.
| Line | Quantity | Bucket | Buyer-side price (low to high) | Net per unit (divided by 1.15) | Line total |
|---|---|---|---|---|---|
| A commodity case | 40 | Sellable when read | 1,500 to 1,550 | 1,304 to 1,348 | 52,174 to 53,913 |
| B one skin | 1 | Sellable when read | three comparable listings at 22,000 to 27,000 | 19,130 to 23,478 | 19,130 to 23,478 |
| C dated items | 6 | Dated | left out of the total | not applicable | not applicable |
| D non-marketable items | 12 | Not sellable | left out | not applicable | not applicable |
| Total, as read | about 71,300 to 77,400 |
The top of the range is about 8.5% above the bottom. A range avoids the false precision of one number. If I had to quote one, I would quote the low end, because receiving less than you expected upsets plans more than receiving more. That is my judgment. Line A assumes a deep market like the case I read, so it carries no separate depth adjustment. Line B uses the span of the listings I compared in place of a price by name. Line C goes back on the sheet as a new line once its date has passed and you have read its price again.
A sheet like this records the moment the prices were read. The lowest listing on the item page I read moved from 1,530 to 1,580 won in three minutes, and the steamdb.com price table is a snapshot refreshed daily. So write the reading time at the top, and on the day you decide to list, read the two price columns again. Do not set a selling price from a sheet that is several days old.
The last check is one unit in the sell window. The Subscriber Agreement says fees for Subscription Marketplaces are disclosed before the transaction completes, and the Market FAQ says the fee is shown on the confirmation page before purchase. This site's Community Market guide tells sellers to read the amount the buyer pays and the amount they receive separately before confirming. I have never opened a sell window, so I rely on that guide for this point. If the proceeds shown there differ from your division by more than rounding, the game fee may not be 10%. The FAQ states game fees for those four games only. For those lines, use the proceeds the sell window shows instead of dividing by 1.15.
Verifying with a single unit also matters because the Market FAQ says all purchases are final and that you have no right to a refund or a reversal of a completed Market transaction. The confirmations page says every Market listing must be confirmed by email or the mobile app before it is posted, with no way to opt out, and that this lets you check the price before it is final.
Next steps, in order:
1. Find the settings on the site you have been using: price type, whether fees are deducted, market and currency, how unpriced items are handled and the price time. Leave a blank where you find nothing, and treat that total as a pre-fee number. 2. Open the item descriptions in your inventory and sort items into sellable when read, dated and not sellable. Check also whether Market selling is open on your account. 3. For each sellable line, read the highest buy order, the lowest listing and the quantities in the top five rows on the item page, and write down the time. 4. For Team Fortress 2, Dota 2, Counter-Strike 2 and Artifact items, divide by 1.15. For other lines, work from the proceeds in the sell window. 5. Compare the total with the Wallet limit, check one unit in the sell window, and then list the rest.
Beyond the limits listed at the start, three things stay open: the order book comes from one item at two moments, I do not know how much of a buyer's price is tax, and the fee rates and limits are the numbers I read on October 27, 2026, which the FAQ says can change.