
Sack of Gems Price: What Moves It and How to Read a Market Page
How to judge whether a Steam Sack of Gems price is high or low: three numbers, order-book depth, sale history and what Valve documents on Gem demand and supply.
Article languages
On this page
You open the Market page for a Sack of Gems and the lowest listing says 900 won. Is that high? Would a few days of waiting change it? A seller looking at the same page has the mirror question. There is no list price to check against: prices come from users' listings and buy orders, as the Market FAQ describes, and none of the Valve pages I read explains why a Sack of Gems rises or falls.
So there is no verdict here, only a reading order. Separate the three numbers that all get called "the price", see how far down the order book your own quantity reaches, and tell the sale history graph from the book. The demand and supply sections then cover the uses and sources of Gems as far as Valve documents them. They mix confirmed rules with my inference and say which is which, and none of it proves what drives the price.
Two topics are left out. One is the price itself, which keeps changing; read it on the Sack of Gems item page and on Steam's own Market page. The other is whether to craft booster packs or sell, which the crafting-versus-selling comparison already covers.
My sources are pages I opened on October 27, 2026: the Community Market FAQ, the Trading Cards FAQ, the Trading and Market Restrictions help page, and the archived page for the 2014 Holiday Auction. I opened the Sack of Gems Market page at about 3:38 pm Korean time (06:38 UTC) and again roughly 50 seconds later in the English interface, and saved the page text both times. Every price in this article comes from those saved copies, in won, and records that moment only. No purchase or sale was made for this article, and the Booster Pack Creator needs a sign-in, so I could not read it. Where a passage leans on forum posts or my own reasoning, it says so. The diagrams are explanatory, not Steam screenshots.
Three different numbers hide behind the word price
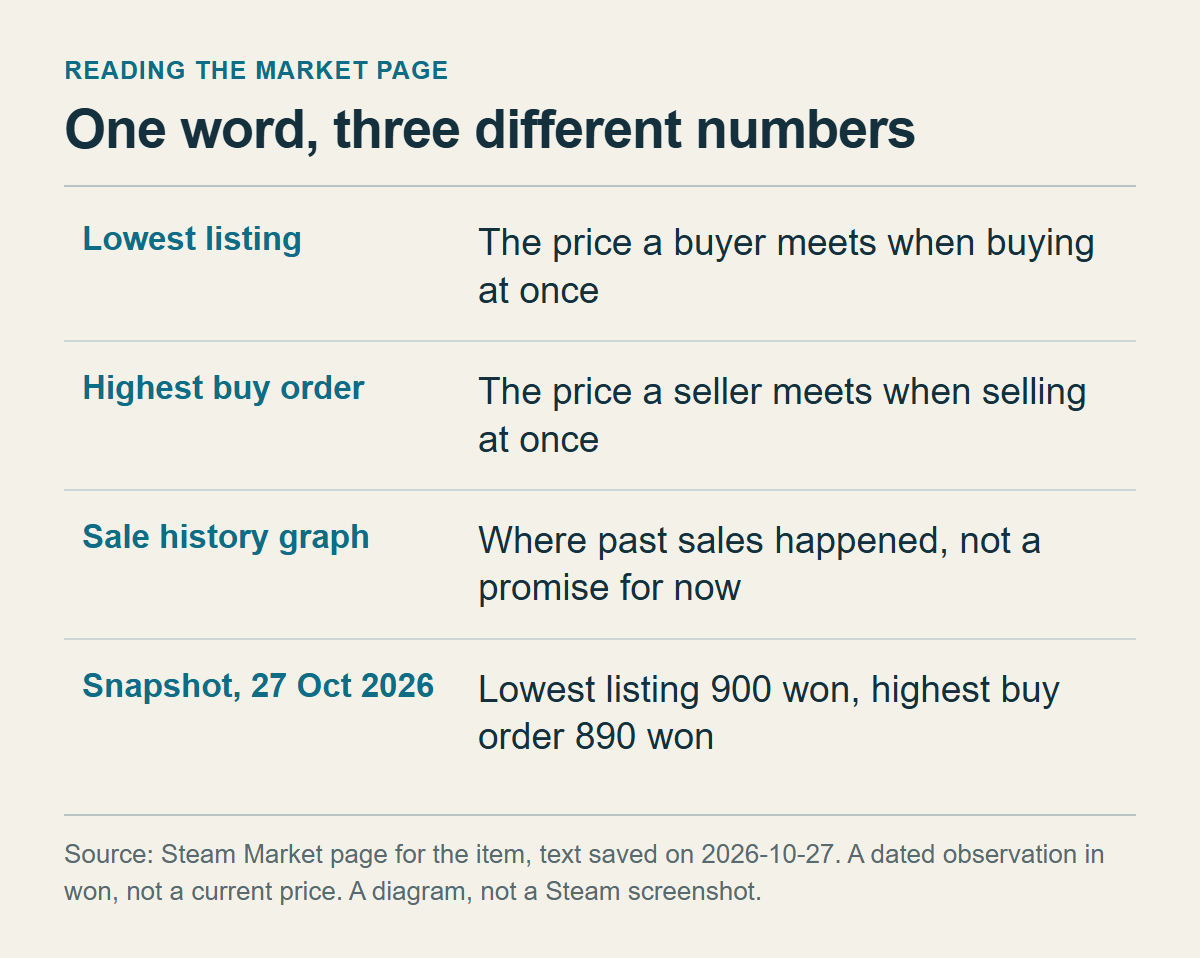
Before it shows a single price, the Sack of Gems page says what kind of item this is: a commodity, "where all the individual items are effectively identical". Individual listings are not accessible. You issue an order to buy at a specific price, and the cheapest listing is automatically matched to the highest buy order. The Community Market FAQ defines a commodity the same way: identical items traded interchangeably, no individual listings, an item selected for you when you place an order.
That is why the page has columns of prices instead of one, and why "the price" can mean three things.
The lowest listing is the cheapest sell offer. It is the price a buyer meets when buying at once. The highest buy order is the best standing bid, and it is the price a seller meets when selling at once. The sale history graph is the third number: it shows where finished sales happened over a chosen period. The first two are offers standing on the page at that moment; the graph is a record of what already happened, and it promises nothing for the moment you click.
If the two top rows do not touch, the matching rule says nothing will match between them, so both sides wait. That is my reading of the rule, not a sentence Valve wrote.
In the capture of October 27, 2026 (about 3:38 pm Korean time), the lowest listing was 900 won and the highest buy order was 890 won, a gap of 10 won, about 1.1% of 900. If you open the page later you will see other numbers. What carries over is the width of the gap: at that moment buying and selling at once were roughly one percent apart.
The three numbers answer different questions, so pick the one that matches your side. A buyer who needs Gems now starts from the lowest listing. A seller who needs to sell now starts from the highest buy order. Someone who can wait places a buy order under the gap or a listing above it. The FAQ gives the same reason buy orders help sellers: they show what other users will pay, so you can choose a lower price to sell immediately or a higher one and wait. Compare buyer with buyer and seller with seller. If one person calls the buy-order price "the price" and the other means the listing price, they are discussing two different numbers.
Other posts on this site use different words for the same things. What Is a Steam Sack of Gems? lists the lowest sell listing, the highest buy order and a recent sale price as three separate pieces of information. In the page text I saved there was no separate last-sale number, only the graph of median sale prices, so this article calls the third number the sale history graph. The fees and order-book post calls the gap between the top rows the spread and the effect of a large quantity on the price slippage. The gap and the depth in this article are those two ideas.
None of the three numbers says whether the level is high or low. For that you have to lay the usual range from the graph over the thickness of the order book, and the next sections do it in that order.
Read down to the row your quantity reaches, not the page totals
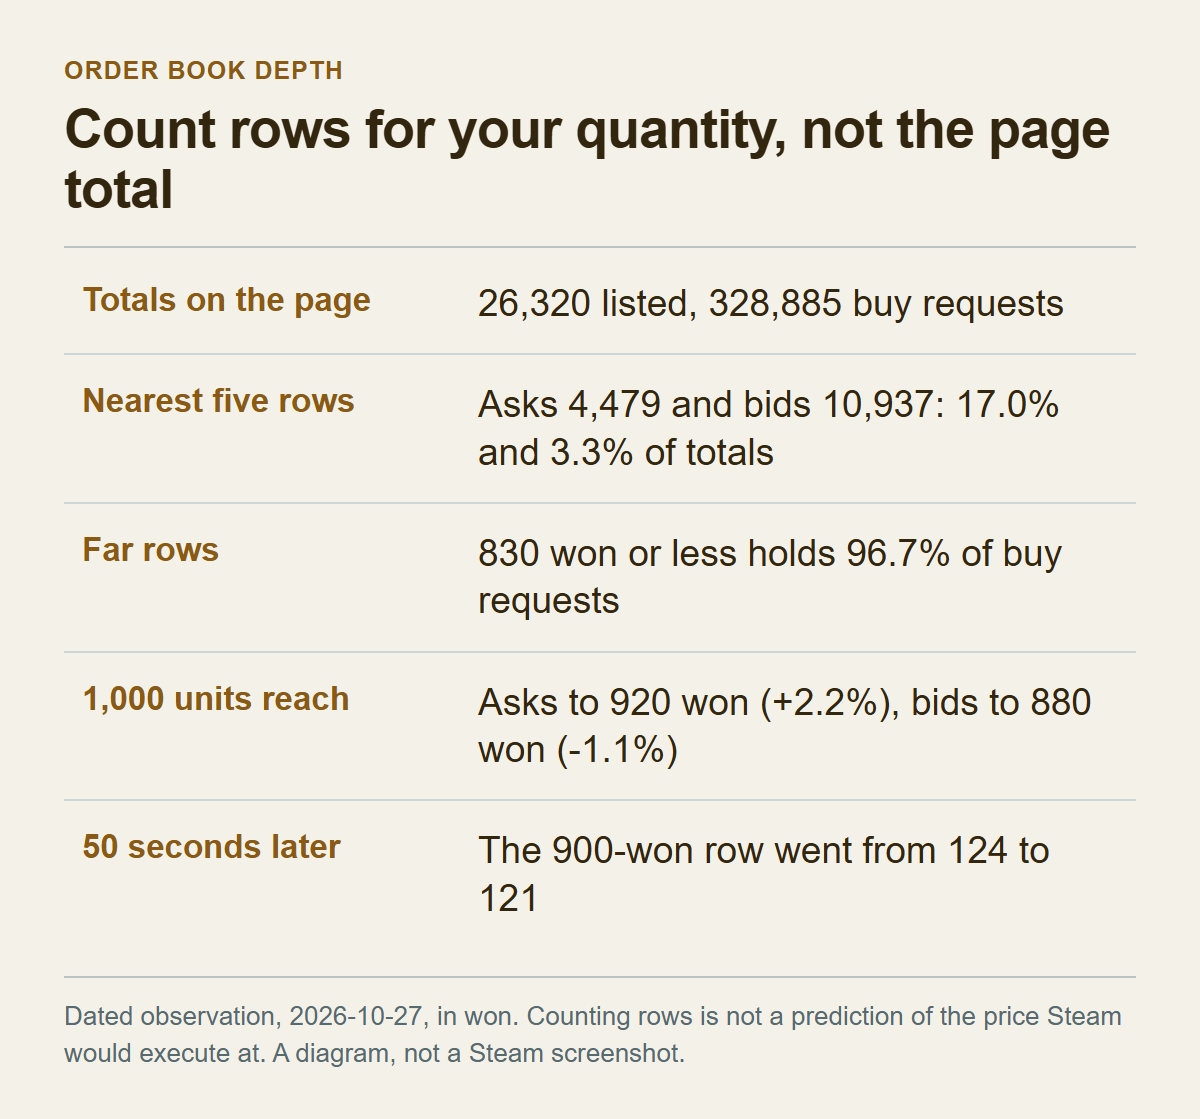
The tables on the Market page list a quantity for each price. Sell listings run from the cheapest row upward, buy orders from the highest row downward, and the last row of each table bundles every price beyond it into one line ("950 won or more", "830 won or less"). Here is the capture from October 27, 2026, about 3:38 pm Korean time, in won:
| Row | Sell listings: price | Quantity | Buy orders: price | Quantity |
|---|---|---|---|---|
| 1 | 900 | 124 | 890 | 292 |
| 2 | 910 | 184 | 880 | 3,931 |
| 3 | 920 | 770 | 870 | 1,256 |
| 4 | 930 | 2,196 | 850 | 290 |
| 5 | 940 | 1,205 | 840 | 5,168 |
| 6 | 950 or more | 21,841 | 830 or less | 317,948 |
| Total | 26,320 | 328,885 |
The buy side has no 860 row. I read that as no buy order at that price.
The first thing the eye lands on is the totals: 26,320 listed and 328,885 requests to buy, which makes buy requests look 12.5 times larger than listings (a count of units, not of buyers). Add up the rows and most of that sits far from the price. 96.7% of the buy requests are in the single "830 won or less" row. The five buy rows nearest the top, 890 down to 840, add up to 10,937, only 3.3% of the total. On the sell side, 83.0% of the listings are in the "950 won or more" row, and the five nearest rows come to 4,479, or 17.0%. Compare just the near rows and the buy side leads by about 2.4 to 1 (10,937 against 4,479), not 12.5 to 1. The totals show how much is standing on the page. They do not show how much could change hands near the top price. I also cannot see where inside the "830 won or less" row those orders sit. My view, which is inference, is that quantity far from the top matters only if the price moves down to it.
To read the table for your own quantity, add rows cumulatively from the top. For 100 units the first row already covers you on either side (124 listed, 292 bid), so the top price is your price. To buy 1,000, you have to go down to the 920 row, where the running total reaches 1,078. That price is 2.2% above the lowest listing. To sell 1,000, the running total passes it at the 880 row, at 4,223, which is 1.1% below the highest buy order. One caution: 880 is the lowest price at which buy orders exist for that many units. It is not what a listing placed at 900 or above would receive. The fee post says Steam does not push a seller's listing below the price the seller sets, but its depth example is hypothetical, while this table is a dated record. The crafting-versus-selling post also tells a seller to check order depth for the quantity and not only the lowest asking price, and the rows above are that step carried out with dated numbers.
To sell 10,000 units you have to reach the 840 row, where the total first covers it at 10,937, which is 5.6% below the top bid. To buy 10,000, the table cannot help: the five rows through 940 hold only 4,479 units, and the rest sit in the "950 won or more" row, whose prices are hidden.
All of that is row counting. How Steam would execute a given quantity, and at what price, is not written on any page I read. The FAQ says that when several buy orders could take a newly listed item, the oldest matching one is chosen (a change made in 2017 for fairness across currencies), while the item page says the cheapest listing meets the highest buy order. Neither page says how those fit together. The post on why a Steam buy order is not filled works through that gap, so I do not repeat it. Here the order book is a table for judging how far your quantity reaches, not for reading an execution price. The page also has a second graph, Buy and Sell Orders (cumulative). I did not read its shape, and the buy-order post already covers it.
The book moves, too. I loaded the same page twice, about 50 seconds apart, and the 900-won row changed from 124 to 121 units while the number of listings changed from 26,320 to 26,317. The lowest listing, the highest buy order and the buy-side rows stayed the same. Three units is a small difference, but it shows that a quantity on the screen is not promised to be there when you act. The FAQ adds that the system may cancel buy orders at any time for several reasons, among them changes to the item, the wallet, the purchase or the account. If you are planning a large quantity, read the table again just before you move.
Sale history and the order book answer different questions
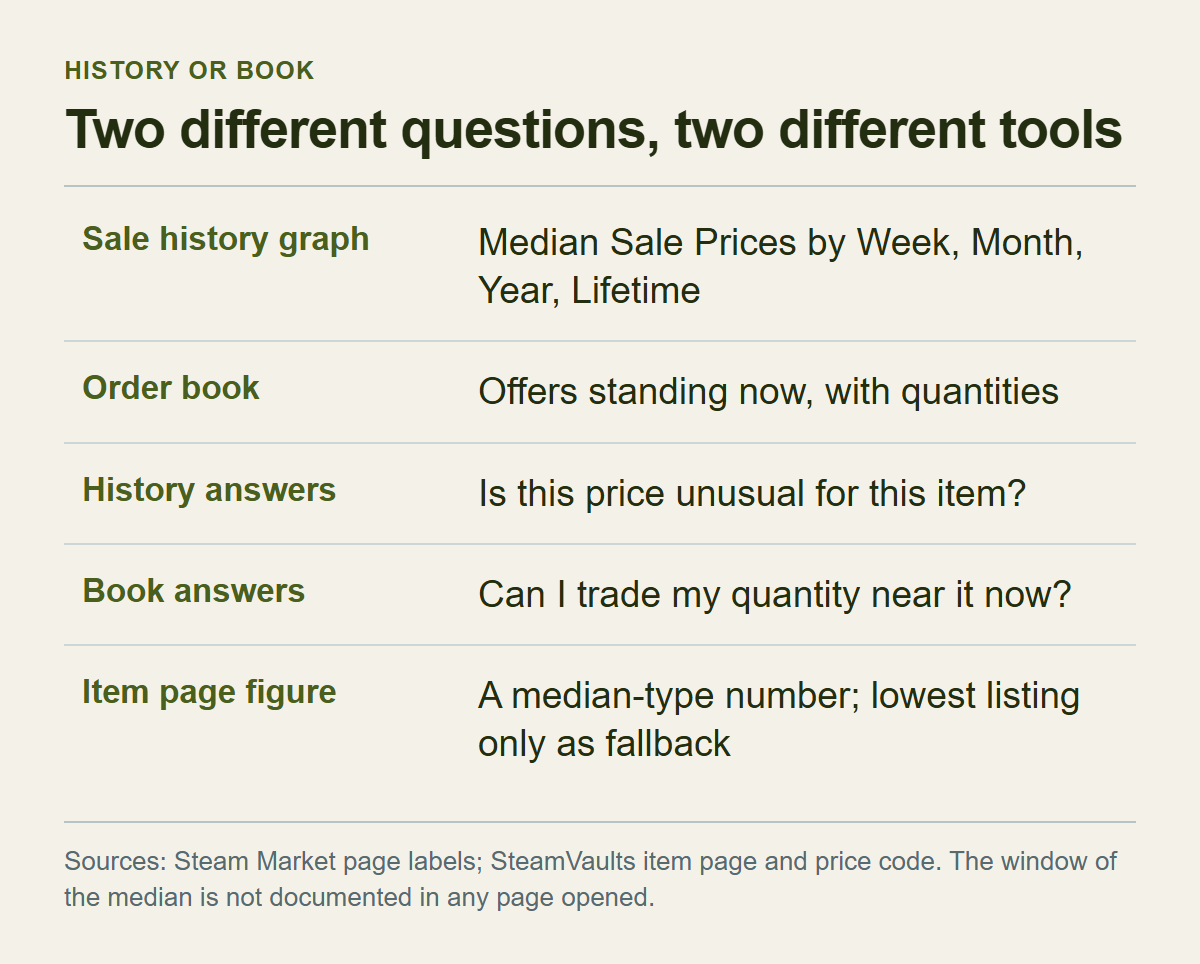
Below the tables the page has a graph. In the English interface it is titled Median Sale Prices, and Week, Month, Year and Lifetime buttons choose the period. A separate Volume axis sits next to the price axis. The Korean interface labels the same graph with a name that translates as "average sale price", with buttons for weekly, monthly, yearly and all-time. A median and an average are different statistics. No page I opened says whether the two names describe the same calculation. I suspect the English name is the original and read the graph as a median, but that is a guess. The reading rule is the same either way. The line shows at what prices sales happened in that period, not the price of the last sale. The text I saved contains no number you could call a last-sale price. Hovering over the graph may show a value for each point, but I read only the page text and did not test it.
The graph and the order book have different jobs. The graph answers "is this price usual for this item?". A long period shows the usual range and a short one shows recent movement. The book, meaning the two tables of offers standing on the page with a quantity beside each price, answers "can I trade my quantity near this price now?". The graph does not show the past of the book either. How thick the book was on a morning last week cannot be read from it.
When the two disagree, decide beforehand which one you trust for which question. This is my judgment. Use the book to decide whether to act now. If the graph says the price is in its usual range but the row your quantity reaches is outside that range, the price you would actually pay is outside it. Use the graph to decide whether a price is unusual. If the lowest listing sits well outside the usual range, look at whether the rows behind it are thick. A price set by one or two cheap listings at the top can fall back easily. If the rows behind it have moved too, a real shift is more likely. That is inference as well.
One more number should be kept apart. The figure on the SteamVaults item page for Sack of Gems may not match any row on the Market page. The Korean version of the item page, which is the one I read, calls it a market estimate based on Steam Community Market data and says the amount you could actually get appears only in a time-limited quote. In this site's price lookup code, the figure comes from the median_price field of Steam's price overview response, with lowest_price used only when the median is missing, and the request is made in US dollars. So it sits closer to the sale-record side than to the lowest listing. The code also has a step that rejects a new value that strays too far from the previous one, so I cannot say the number on screen is exactly the response just received. How many hours or days that median covers is not documented on any page I opened. The code is in a private repository that readers cannot open, and it can change. So the item page figure has one use: compare it with the sale history graph on the Market page. Setting it beside the lowest listing puts two different kinds of number side by side, one requested in dollars and the other shown in won on the page I saved.
Booster packs are the one use Valve names, and the size of demand is not public
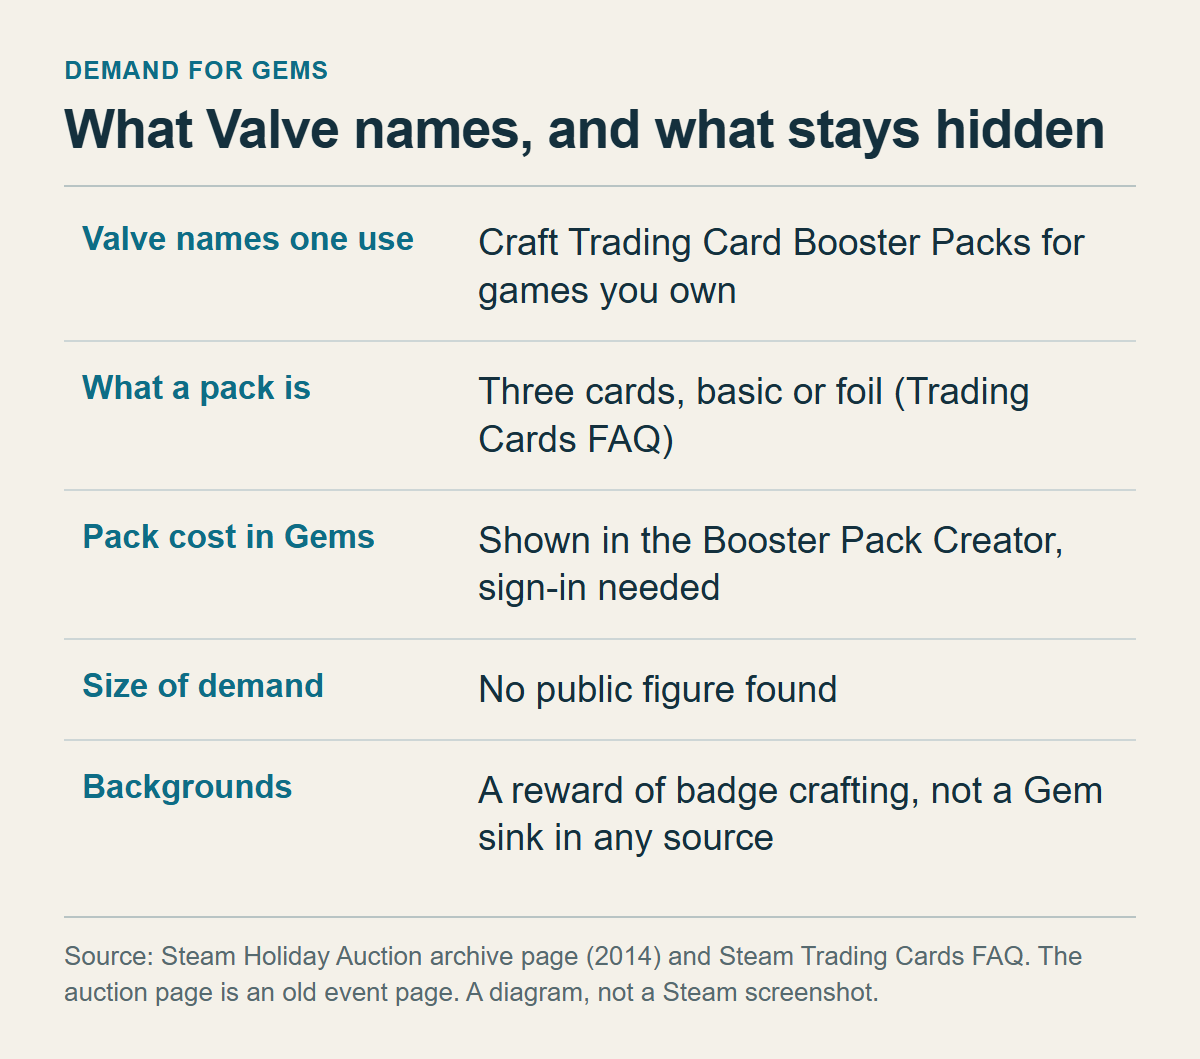
What do people buy Sacks of Gems for? Valve states two uses on the pages I found. One was bidding in that auction, which has ended. The other is crafting Trading Card Booster Packs for games you own, and that is the one that outlasted it. It is in the archived page for the 2014 Holiday Auction, which Valve left up after the event ended. It says, "Got extra Gems? Use it to craft Trading Card Booster Packs for games you own." It adds that Gems do not disappear when the auction ends and can keep being used to create Booster Packs. Because the page is an old event notice, it does not guarantee that the rules are unchanged. It is the only Valve document I found that names a use, and the condition "for games you own" is in the same sentence.
The Trading Cards FAQ says a booster pack is three trading cards, which may include both basic and foil cards. The same FAQ describes a way to get packs without Gems: eligible users, meaning those who have received all their card drops, are granted packs at random as the community crafts more badges. Making a pack from Gems is a separate choice. The FAQ never mentions the word Gems. To learn how many Gems a pack costs, you have to open the Booster Pack Creator, which asks for a sign-in; opened signed out, it showed only a login form. For that reason this article has no table of Gem costs per game. A forum thread from November 2018, "What are gems and booster packs", has users saying that crafting is limited to once per 24 hours per game. That is a user report, and I could not confirm it in a Valve document.
Here is my own reasoning. Someone with 1,000 Gems can pack them into a Sack and sell it, or spend Gems on a three-card pack. A person crafting for profit would craft when the expected sale value of the three cards, after fees, beats what the Gems would fetch as a Sack. A collector might craft regardless. If that is right, part of the demand for Gems follows card prices: when the cards in craftable packs get more expensive, crafting becomes more attractive and Gems are in demand; when many packs are released and card prices fall, crafting loses its pull.
A user in a forum thread from December 2018, the one titled "Why are Sacks of Gems so cheap?", put it in similar terms. A few games have packs that cost fewer than 1,000 Gems to craft and sell for more than a Sack, and the user added that some of those packs had recently dropped in price. That is one person's observation, not a time series. A user in the November 2018 thread says the opposite: converting items to Gems to craft packs is usually a waste, and you are better off selling a Sack and buying the cards you need. Users disagree about whether crafting is a good deal. That disagreement hints that the demand may not be steady, but it says nothing about how large it is.
I found no figure from Steam on how many Gems are spent per day. So "demand has risen" is not a sentence this article can confirm. There is also no reason to assume that everyone who buys a Sack plans to craft. Resellers, people who store Gems, and services that accept Sacks may all exist, and no source measures their volume. SteamVaults is itself one of them: its sell page accepts tradable Sacks and credits a USDT site balance once the bot confirms receipt. Please do not read this section as neutral market analysis. What you can do yourself is take a game you own, look at the Gem cost on the Booster Pack Creator, and set it beside the prices of cards and packs on the Market. The crafting-versus-selling post walks through that comparison.
Backgrounds need a note. I found no document saying Gems are spent on profile backgrounds or emoticons. In the Trading Cards FAQ, crafting a badge gives a random emoticon, a random profile background, a chance of a discount coupon and 100 XP, and the FAQ says emoticons and backgrounds can be traded or sold on the Market. So background crafting belongs on the side where items come into existence, which is the next section.
Supply starts with recycled items, and Sacks stay listed until someone buys or removes them
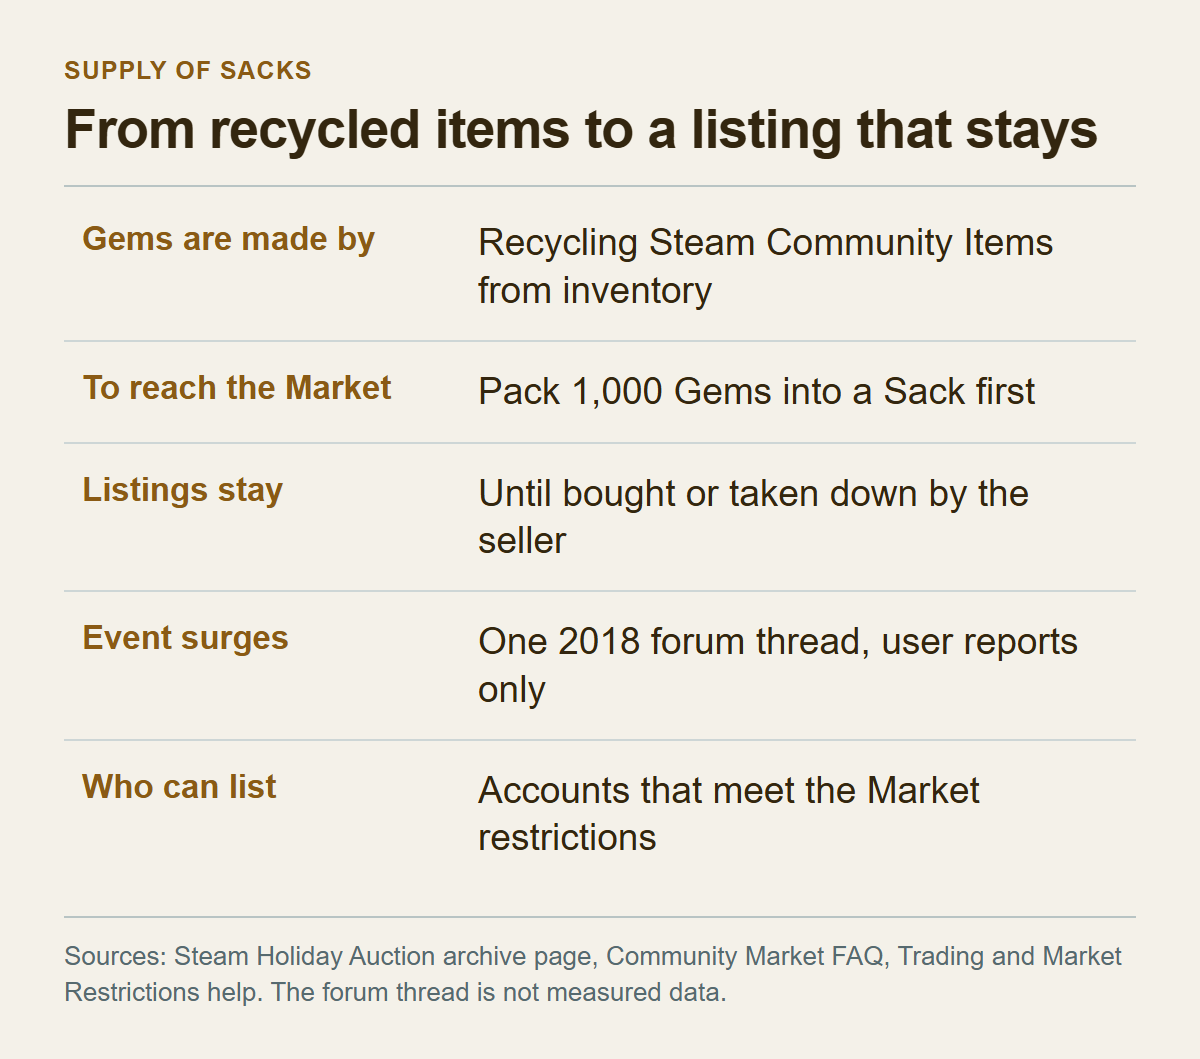
The same Holiday Auction page explains how Gems are made. In your Inventory you select the Steam tab and choose "Community" from the drop-down to see eligible items. Each shows its Gem value and a button to recycle it. So Gems come from recycling Steam Community Items that already exist. The page also says that Gems can be placed on the Community Market only after being packed into a Sack of Gems. Loose Gems cannot be listed; a Sack, which holds 1,000 Gems, can.
Here is my sketch of how the pieces could connect. It is not a documented cycle. Playing games drops cards, and according to the Trading Cards FAQ most games drop a number of cards equal to about half the cards in the set. Collecting a full set lets you craft a badge, and crafting a badge gives a random background and a random emoticon. Cards and backgrounds can be sold on the Market, which the FAQ states. Whether they can also be recycled into Gems is not stated: the auction page says only that eligible "Steam Community Items" show a Gem value and a recycle button, and it does not say which items qualify. How Many Gems Do Cards, Backgrounds and Emoticons Give? takes up the per-item question. If they can, then Gems feed packs and packs yield cards, and the price of a Sack would be one point on that loop: more recycled items would suggest more Sacks, and more crafting would take Gems out. That last step is inference.
How much that loop moves the price is something I have one piece of evidence for: a forum thread posted on December 27, 2018, during a sale. The poster asked why Sacks were cheaper than usual. Two replies said many people had converted sale-badge and event items into Gems, so supply had grown, and one reply mentions that an event item converts to 100 Gems. One reply says prices recover after events and another says they will not fully recover. What the thread shows is how users explained a price change. It is not a measured series, it covers one sale, and it has eight comments. The prices quoted in it are the users' own numbers, so I did not carry them over.
This site's post on selling safely takes the same position: booster-pack demand can change the Gems price, a sale does not guarantee a rise, and there is no verified time series for seasonal returns. I take the same position. I did not find a rule, from anyone, that a sale lowers or raises the price.
Supply has one more property worth checking. A listing stays until it sells or the seller takes it down; the FAQ says any listing can be removed before it is purchased. In the table above, 83.0% of the 26,320 listings were in the "950 won or more" row. My inference is that supply parked that far from the top affects the lowest price only after rising demand has absorbed the near rows, which hold 4,479 units between 900 and 940 won. On the other hand, new listings priced lower can thicken the first rows quickly. So when a price drops, there are two separate questions. Did only the lowest price fall while the near rows got thinner, or did the rows behind it get thicker as well? One look at one book cannot answer that, and the answer needs looks on different dates.
Gems you recycled may not be sellable as a Sack straight away, either. The Market FAQ says the account needs a successful purchase older than 7 days, but not older than a year, and Steam Guard enabled for 15 days. The Trading and Market Restrictions page lists more reasons an account cannot trade or use the Market, among them a password reset, a newly authorized device and changes to the mobile authenticator. It also says items purchased in-game or on the Market may not be tradable or marketable until the date shown on the item. I could not find out whether a Sack bought on the Market carries such a date. A related problem, where loose Gems sit in several stacks that cannot be packed together, is covered from user reports in why 1,000+ Gems may not pack into a Sack. For this article the conclusion is short. The amount of Gems that exist and the amount of Sacks that can reach the Market are not the same, and a delay may sit between them. How long it lasts depends on the account, and I do not know it.
Price steps, currency and fees can hide a small move
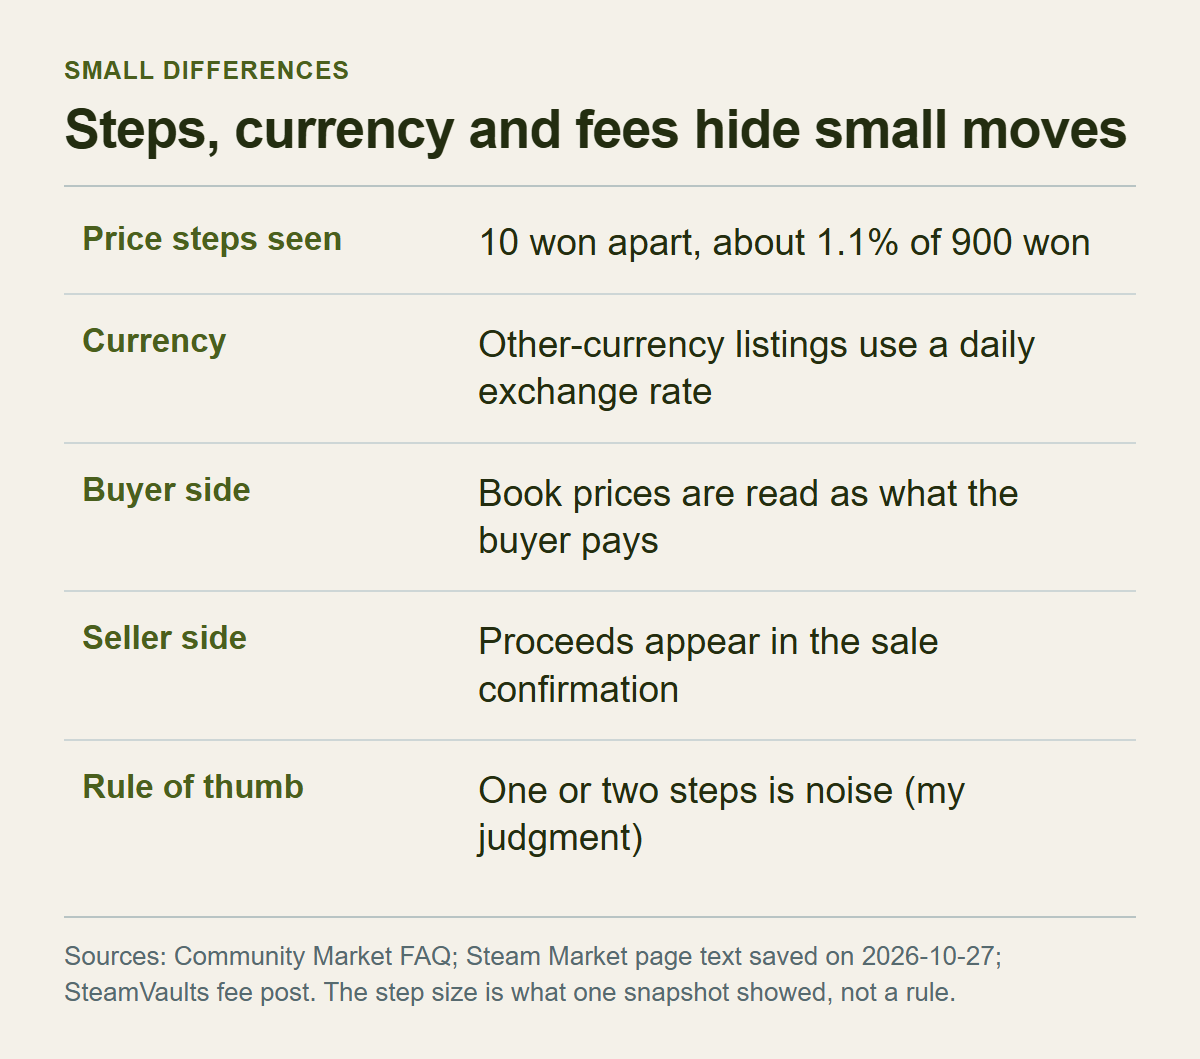
The rows in the table above are 10 won apart, which at 900 won is about 1.1%. A change of one row is one price step, too small to call a rise or a fall. Whether 10 won is a rule I do not know; it is only the spacing in my capture. In my judgment, a one or two step difference is closer to noise than to signal. A meaningful change is wider than that or moves several rows together.
Currency can shift the numbers too. The FAQ says sellers list items in the currency of their own Steam Wallet and buyers see prices in the currency of theirs. A listing in another currency is shown after conversion at an exchange rate that Steam updates daily. A lowest listing you see in won could therefore be a listing made in another currency and converted. The same Sack can move differently on a dollar screen and a won screen because of exchange rates. Pick one currency and read in that one, rather than switching between screens and comparing.
Fees raise the question of which side a number belongs to. As I read the FAQ on October 27, 2026, it gives the Steam Transaction Fee as 5% with a minimum of USD 0.01, paid by the buyer and shown on the confirmation page before purchase. The natural reading is that the prices in the table are the buyer's side, with the fee on top. The English version of the fee post says that the price on a Sack of Gems Market page is the buyer's price. The Korean version says only that the buyer's payment and the seller's proceeds appear separately at the sale confirmation. I treated the 900 and 890 won above as buyer-side figures. The text of the Market page itself does not say the fee is included. The English page ends with "VAT included in all prices where applicable", which is a tax notice and does not say a transaction fee is included.
Two things follow. If you are selling and want to know whether a price is high or low, judge it by the proceeds on the sale confirmation, not by the number in the table. And if you hold a purchase quote or offer from somewhere else, put it next to the Market table only after checking that both are the same side. The arithmetic belongs to the fee post, and I leave it there.
Build your own range in four steps
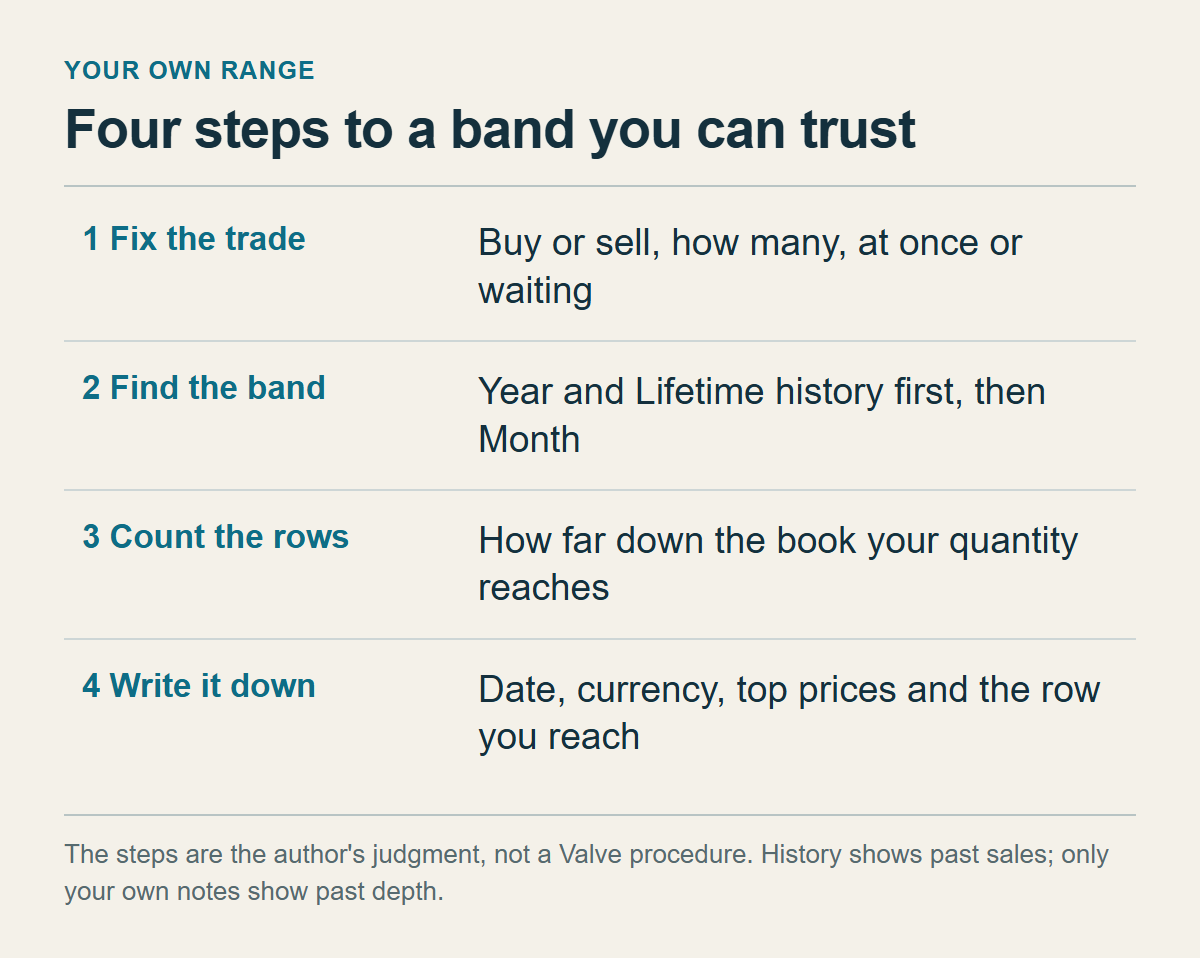
No official number tells you whether a price is high or low, so you have to build your own range. The steps and thresholds below are my judgment, not a Valve procedure.
Step 1 is to fix the trade. Are you buying or selling, how many units, and must it happen at once or can you wait? The same price can be fine for someone buying 100 units and useless to someone selling 10,000. As the book-depth section showed, a different quantity means different rows to read.
Step 2 is to find the band. Open the Market page in your own wallet currency and look at the sale history graph, starting with Year and Lifetime and then narrowing to Month. Write down the range in which the item has mostly traded. Write it as a span ("inside this width"), not as an exact value. Then look at where the recent month sits within it. Check the Volume axis as well. If the price moves while volume is empty, the move may have come from a thin market.
Step 3 is to count rows. Write down the lowest listing, the highest buy order, the price of the row where your quantity is filled, and how many percent that row is from the top price. If your quantity fills inside the first two or three rows, reading the top price as yours will not mislead you much. If it has to reach far rows, or ends in an "or more" or "or less" row, do not plan around the top price. Then lay the rows over the band. If the top price is inside your band and your quantity fills in the near rows, I read that as an ordinary state. If the top price is outside the band but the near rows are thin, waiting a few days and looking again is worth considering. If it is outside the band, the rows behind it are thick, and sales volume rose with it, the band itself may have moved, so write a new one. This is my reading, not a calculated probability.
If you can wait, decide your waiting price at this point too. The FAQ says a buy order price is the maximum you will spend, and if a cheaper item comes along you pay only the lower price. A seller can post above the highest buy order. In either case, nothing promises when it will fill.
Step 4 is to write it down. One line is enough: date and time, currency, lowest listing, highest buy order, and the price of the row where your quantity fills. The sale history graph does not show how thick the book was in the past, so this note is the only record of it. Rewriting my capture in that format gives: "10/27 15:38 KST, won, sell 900 / buy 890, 1,000 units sell 920 / buy 880". That is an illustration, my snapshot written as a note, and not a later price. Notes like this, collected over time, can start to show whether a one or two step difference is ordinary wobble.
What this article could not show, and what to open next
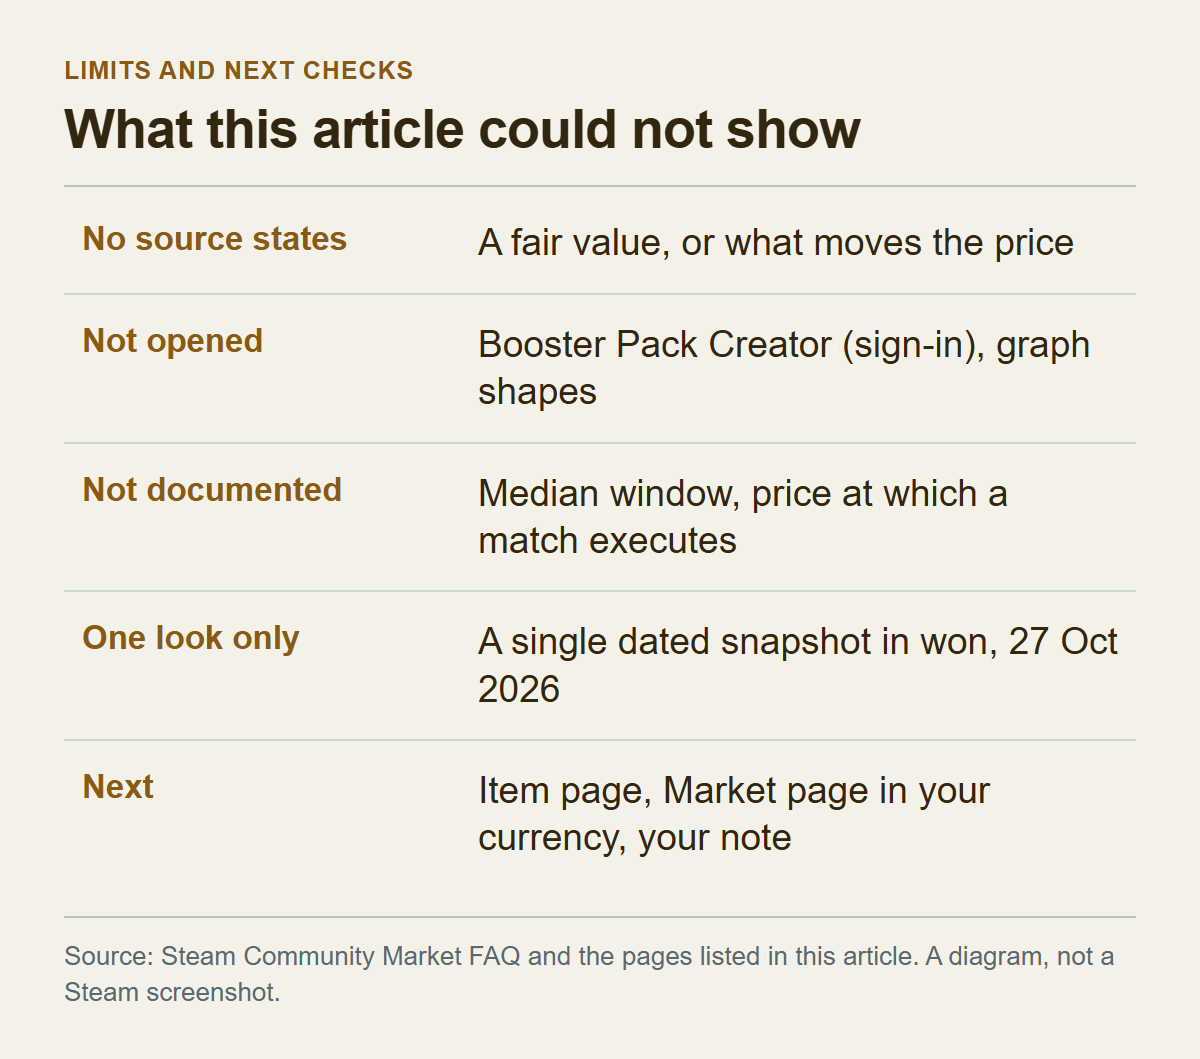
Three things carry a source. A Sack of Gems is a commodity item, so it trades through an order book. Gems are made by recycling Community Items, and a Sack is the only form that goes on the Market. The use Valve documents that outlasted the auction is crafting booster packs. That the top two rows and the sale history graph answer different questions is my reading of how the page works, not a Valve statement.
What no source states is what moves the price. None of the Valve pages I opened gives a fair value or explains why a Sack of Gems gets more or less expensive, and none says how many Gems are made or used per day. The demand and supply sections join those pages to two 2018 forum threads and my own reasoning. I did not open the Booster Pack Creator, which needs a sign-in, and I read the page text but not the shape of either graph. The documents do not give the window of the median or the price at which a match is executed. Every price here is one dated snapshot, in won, from October 27, 2026.
What to open next, in order:
1. The Sack of Gems item page for the reference price and the quote note. As explained above, that figure may not be any row on the Market page. 2. Steam's Market page for the Sack of Gems in your own wallet currency, where you read the sale history graph and write down the usual range. 3. The rows down to your quantity, written down and read again just before you act. 4. If you have somewhere to use the Gems, the crafting-versus-selling comparison. If you want to know what you would receive, the fees post. If a buy order has sat unfilled, why a Steam buy order is not filled.